Jump to Week:
1 |
2 |
3 |
4 |
5 |
6 |
7 |
8 |
9 |
10 |
11 |
12 |
13 |
14 |
15 |
16 |
17 |
18 |
19 |
20 |
21 |
22 |
23 |
24 |
25 |
26 |
27 |
28 |
29 |
30 |
31 |
32 |
33 |
34 |
35 |
36 |
37 |
38 |
39 |
40 |
41 |
42 |
43 |
44 |
45 |
46 |
47 |
48 |
49 |
50 |
51 |
52
Note: All data presented for informational purposes only. BroadwayWorld.com makes no guarantees as to the accuracy of the data, or the matter in which it's presented. Source: The Broadway League..
| YEAR | Total Gross | Avg. Gross | Average Ticket | Top Ticket | Seats Sold |
Total Seats |
Shows | Perf. | Average % |
| 1996 | $13,358,177 | $513,776 | $50.67 | $75.00 | 240,275 | 262,627 | 26 | 205 | 90.13% |
| 1997 | $14,304,413 | $461,433 | $53.32 | $80.00 | 258,150 | 306,026 | 31 | 240 | 83.31% |
| 1998 | $14,090,972 | $469,699 | $55.85 | $80.00 | 245,230 | 298,599 | 30 | 229 | 81.77% |
| 1999 | $11,481,640 | $347,928 | $55.60 | $125.00 | 195,909 | 325,555 | 33 | 249 | 60.05% |
| 2000 | $11,610,913 | $400,376 | $57.10 | $90.00 | 197,035 | 283,249 | 29 | 223 | 70.08% |
| 2001 | $17,779,205 | $634,972 | $64.69 | $480.00 | 261,127 | 273,975 | 28 | 221 | 94.94% |
| 2002 | $21,351,242 | $647,007 | $69.44 | $480.00 | 290,260 | 333,734 | 33 | 264 | 84.76% |
| 2003 | $19,133,149 | $637,772 | $72.95 | $480.00 | 250,981 | 290,044 | 30 | 234 | 84.47% |
| 2004 | $15,674,176 | $522,473 | $68.73 | $251.25 | 214,435 | 282,039 | 30 | 223 | 73.38% |
| 2005 | $15,563,753 | $555,848 | $72.94 | $301.25 | 196,980 | 261,539 | 28 | 205 | 71.75% |
| 2006 | $20,405,253 | $680,175 | $79.41 | $301.25 | 245,635 | 296,787 | 30 | 230 | 80.97% |
| 2007 | $28,320,773 | $858,205 | $89.71 | $351.50 | 300,672 | 351,282 | 33 | 277 | 84.38% |
| 2008 | $25,307,612 | $843,587 | $90.93 | $350.00 | 266,287 | 297,706 | 30 | 234 | 88.40% |
| 2009 | $24,334,031 | $839,105 | $95.63 | $350.00 | 238,974 | 296,077 | 29 | 231 | 79.86% |
| 2010 | $24,993,795 | $694,272 | $91.63 | $352.00 | 250,134 | 330,025 | 36 | 263 | 73.55% |
| 2011 | $23,271,085 | $684,444 | $90.29 | $477.00 | 232,116 | 315,463 | 34 | 250 | 72.68% |
| 2012 | $25,850,278 | $833,880 | $99.41 | $477.00 | 240,913 | 306,605 | 31 | 247 | 77.25% |
| 2013 | $38,783,854 | $1,292,795 | $126.54 | $477.00 | 290,386 | 304,099 | 30 | 246 | 94.10% |
| 2014 | $40,993,951 | $1,138,721 | $123.82 | $475.00 | 318,721 | 346,061 | 36 | 289 | 91.94% |
| 2015 | $36,271,800 | $980,319 | $112.24 | $477.00 | 299,280 | 358,571 | 37 | 287 | 82.35% |
| 2016 | $30,413,716 | $950,429 | $115.80 | $998.00 | 245,913 | 294,117 | 32 | 232 | 83.13% |
| 2017 | $35,795,928 | $1,118,623 | $138.38 | $996.00 | 244,973 | 281,209 | 32 | 233 | 86.95% |
| 2018 | $57,807,272 | $1,482,238 | $141.59 | $849.00 | 378,910 | 409,624 | 39 | 336 | 92.73% |
| 2019 | $55,765,408 | $1,549,039 | $150.99 | $996.00 | 350,714 | 369,448 | 36 | 299 | 94.57% |
| 2022 | $34,827,193 | $1,055,369 | $128.72 | $697.00 | 238,502 | 284,847 | 33 | 236 | 81.08% |
| 2023 | $33,479,026 | $1,239,964 | $139.51 | $649.00 | 226,167 | 250,563 | 27 | 208 | 88.89% |
Note: All data presented for informational purposes only. BroadwayWorld.com makes no guarantees as to the accuracy of the data, or the matter in which it's presented. Source: The Broadway League..
Videos

|
How I Learned to Drive
The Vortex Theatre (5/17 - 6/2) | |

|
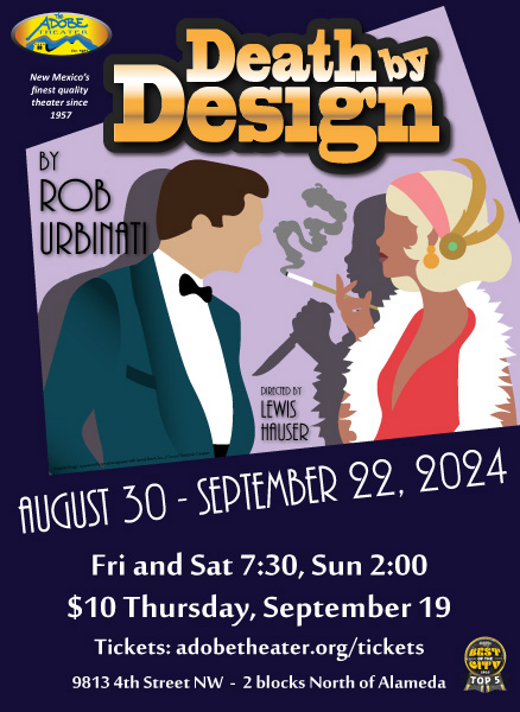
DEATH BY DESIGN
The Adobe Theater (8/30 - 9/22) | |

|
TWELFTH NIGHT by William Shakespeare
Santa Fe Botanical Garden Amphitheater (7/25 - 8/18) | |

|
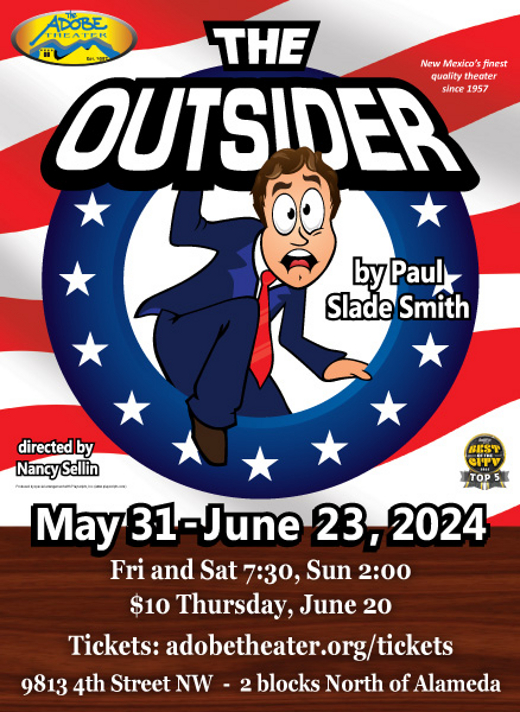
THE OUTSIDER
The Adobe Theater (5/31 - 6/23) | |

|
Into The Woods
Heartstrings Theatre (6/14 - 6/15) | |

|
THE BRIDGES OF MADISON COUNTY
Adobe Theater (7/19 - 8/11) | |

|
Second annual “She Rises” all female music festival feat. YOLA, KT Tunstall, Jade Bird and more benefiting Music Helps ATX
Kit Corner Park (8/30 - 9/1) | |
| VIEW SHOWS ADD A SHOW | ||
Recommended For You


